
February Real Estate Market Update for the Asheville, NC Area
February 7, 2024
We’re about halfway through winter, and the Asheville real estate market is picking up ahead of the spring listing season. Inventory is gradually increasing, and we’re seeing a significant increase in the number of inquiries from both potential buyers and sellers.
Interest Rate Update
Interest rates are about where they were last month – in the mid to upper 6% range. Fannie Mae is predicting a gradual decline in the 30-year mortgage rate over the course of the year. This is great news for buyers, but the same Fannie Mae report predicts a corresponding increase in existing home sales. So this may not result in lower prices as demand increases.
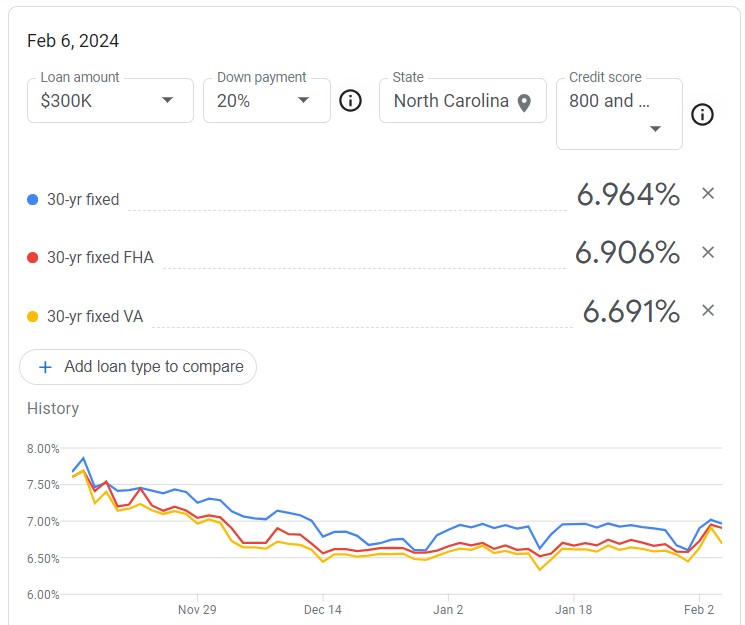
Source: Google
Inventory is Slowly Trending Up
The number of homes for sale countywide is about 10% higher than it was a year ago, but inventory is still well below pre-pandemic levels. Since spring is approaching, we expect more homes to come on the market in the next 30-90 days. A 10% inventory increase is still not enough to keep up with buyer demand, but it’s a step in the right direction. Sellers will still be operating in a strong market, and buyers will have at least a few more options than they’ve had over the past few years. It’s worth noting that the current inventory is the highest it’s been since 2021.
Months Supply is Still Low
The market absorption rate (or months’ supply of homes for sale) remains low. It remains a seller’s market as we approach the spring listing season. If you’re considering selling, this is right time of the year and market conditions are very favorable!
New Listings are Increasing
The number of new listings increased in January, but keep in mind this is a normal, seasonal trend. We should see more homes hit the market from now until June.
January Sales Volume Increased (Year-over-year)
Countywide, the number of sales in January was up from 2023 by 10.6%. January is a low-volume month, so we don’t read too much into this metric. Still, it’s good to see our market remaining active even in the dead of winter.
Some Negotiation is Happening
Reasonable negotiating between buyers and sellers can be expected, with houses selling for about 3.5 percent off the listing price (on average).
Home Prices are Still Climbing (but Slowly)
Countywide, median home prices are up 3.9% year-over-year. Asheville home prices are up 2.7%, and Black Mountain is down 2.0%. Average prices have been slightly stronger, with Buncombe county up 5.1%, Asheville up 3.2%, and Black Mountain down 1.0%.
January Land Sales were Strong
Last month, the number of land sales in the county were up 46% year-over-year. With low housing inventory to choose from, we continue to see buyers seek out lots to build on.
Talk to a Local Agent About the Asheville Real Estate Market
Please feel free to contact us to speak with a local Asheville real estate agent about the real estate market in Asheville, NC and the surrounding areas.
Receive Market Updates via Email
If you’d like to receive our quarterly market updates via email, please subscribe to our newsletter below. Don’t worry – we never share your contact info with anyone!